
Altcoin Market Cap Needs Support
ALTCAP is in the fifth and final wave of a bullish impulse

Altcoin Market Cap Scrambles for Support
IN BRIEF
- ALTCAP has created a double top pattern.
- It has broken down from an ascending support line.
- ALTCAP is in the fifth and final wave of a bullish impulse.
The Trust Project is an international consortium of news organizations building standards of transparency.
The altcoin market cap (ALTCAP) has created a double top pattern close to its all-time high price.
It has also broken down from an ascending support line and is currently attempting to find support above $1 Trillion (tn)
Double top
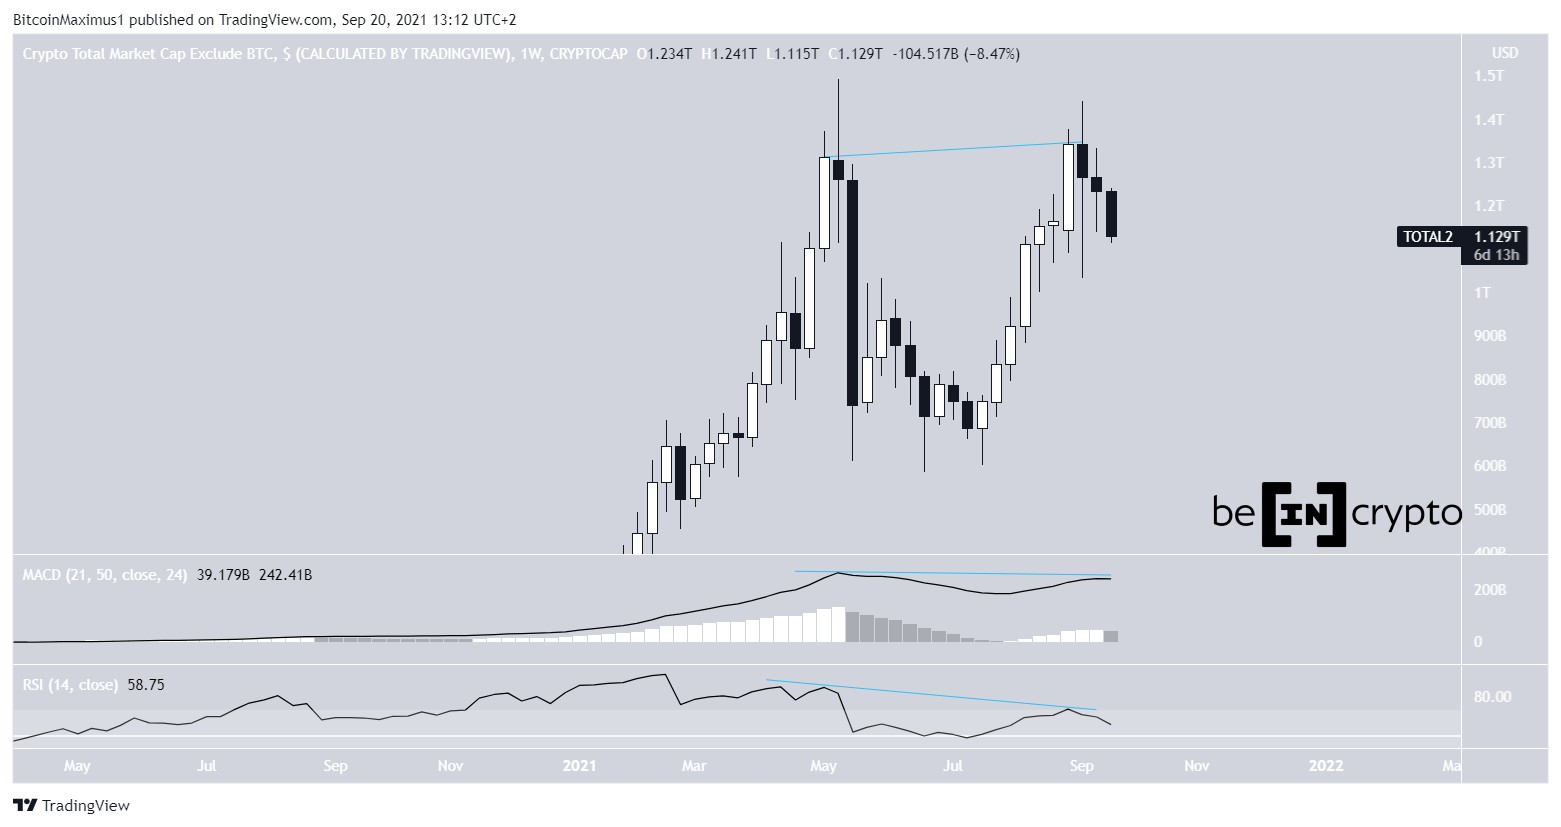
The weekly chart for ALTCAP provides a bearish reading. On Sept 7, it reached a high of $1.44 tn. This was just slightly below the actual all-time high of $1.49 tn, which was reached on May 12.
The same week, it created a long upper wick and has been falling since.
Furthermore, technical indicator readings are bearish. Both the RSI and MACD have generated considerable bearish divergences. In the case of the latter, it is visible in both the histogram and the signal line.
Furthermore, it seems that ALTCAP has created a double top, which is considered a bearish reversal pattern.
Therefore, it is possible that a drop will follow.
Future movement
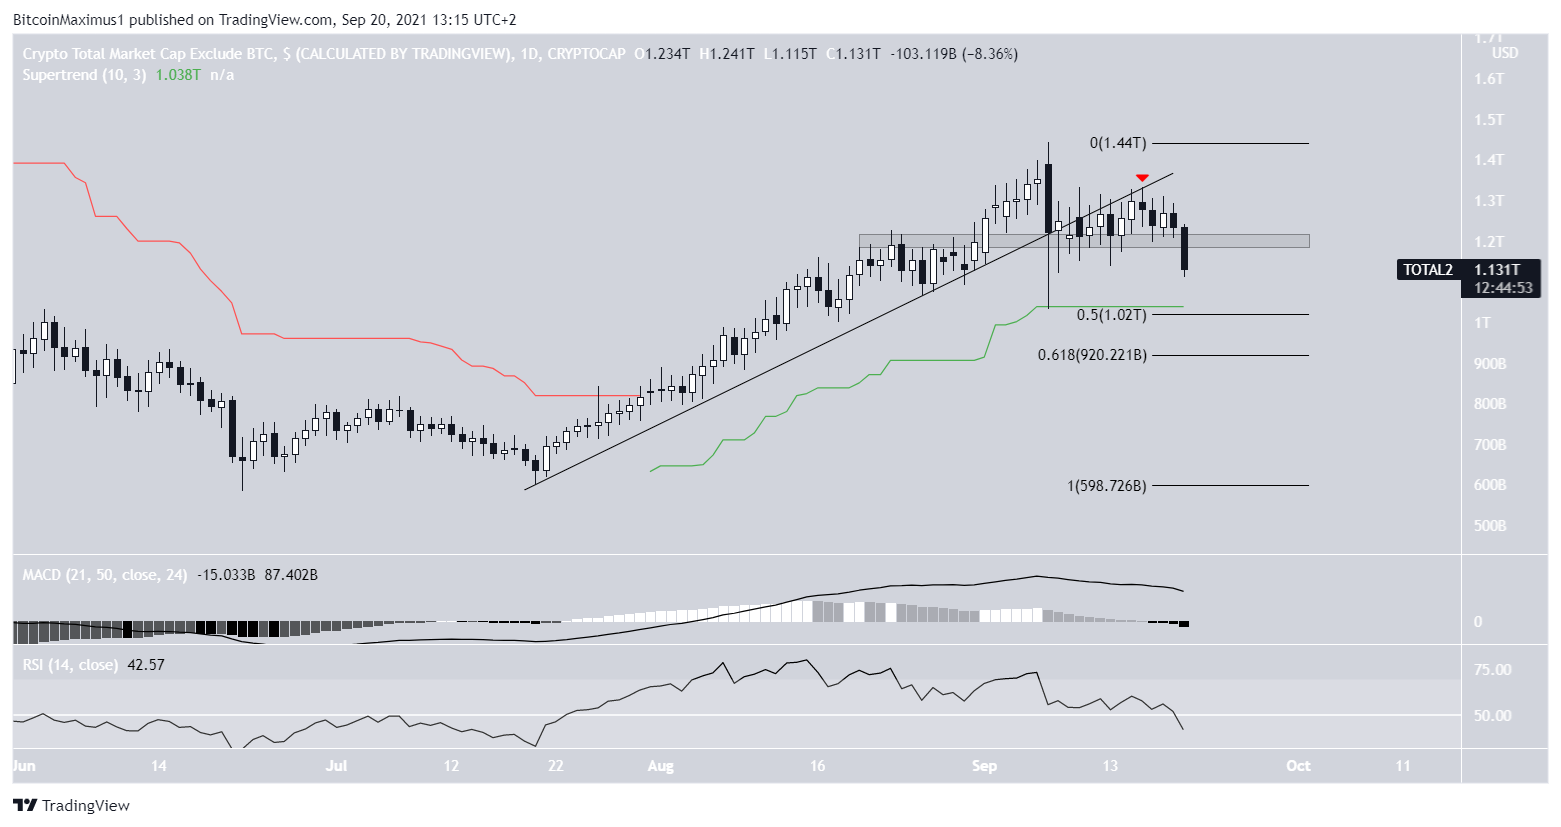
The shorter-term daily chart also supports these readings.
ALTCAP has broken down from an ascending support line and validated it as resistance afterwards. In addition to this, it has fallen below the $1.2 tn horizontal support area.
The RSI and MACD both support the continuation of the downward movement. The former has fallen below 50 while the latter is decreasing, approaching negative territory.
The closest support area is at $1 tn. This is the 0.5 Fib retracement support level and coincides with the Supertrend support (green line).
A decrease to this level would also sweep the Sept 7 low, making it a very likely place for ALTCAP to bounce.
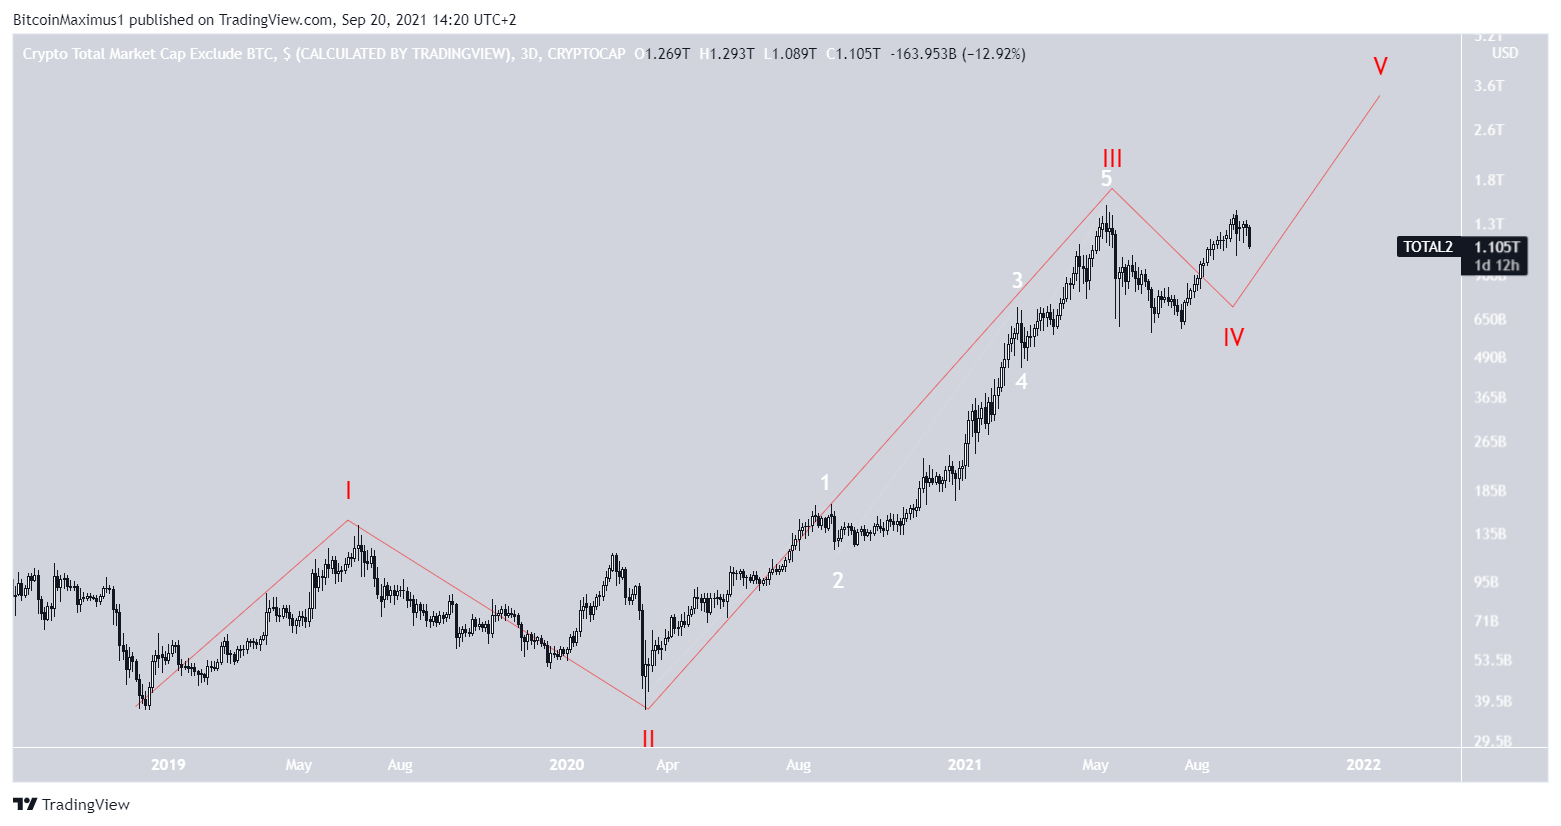
Wave count
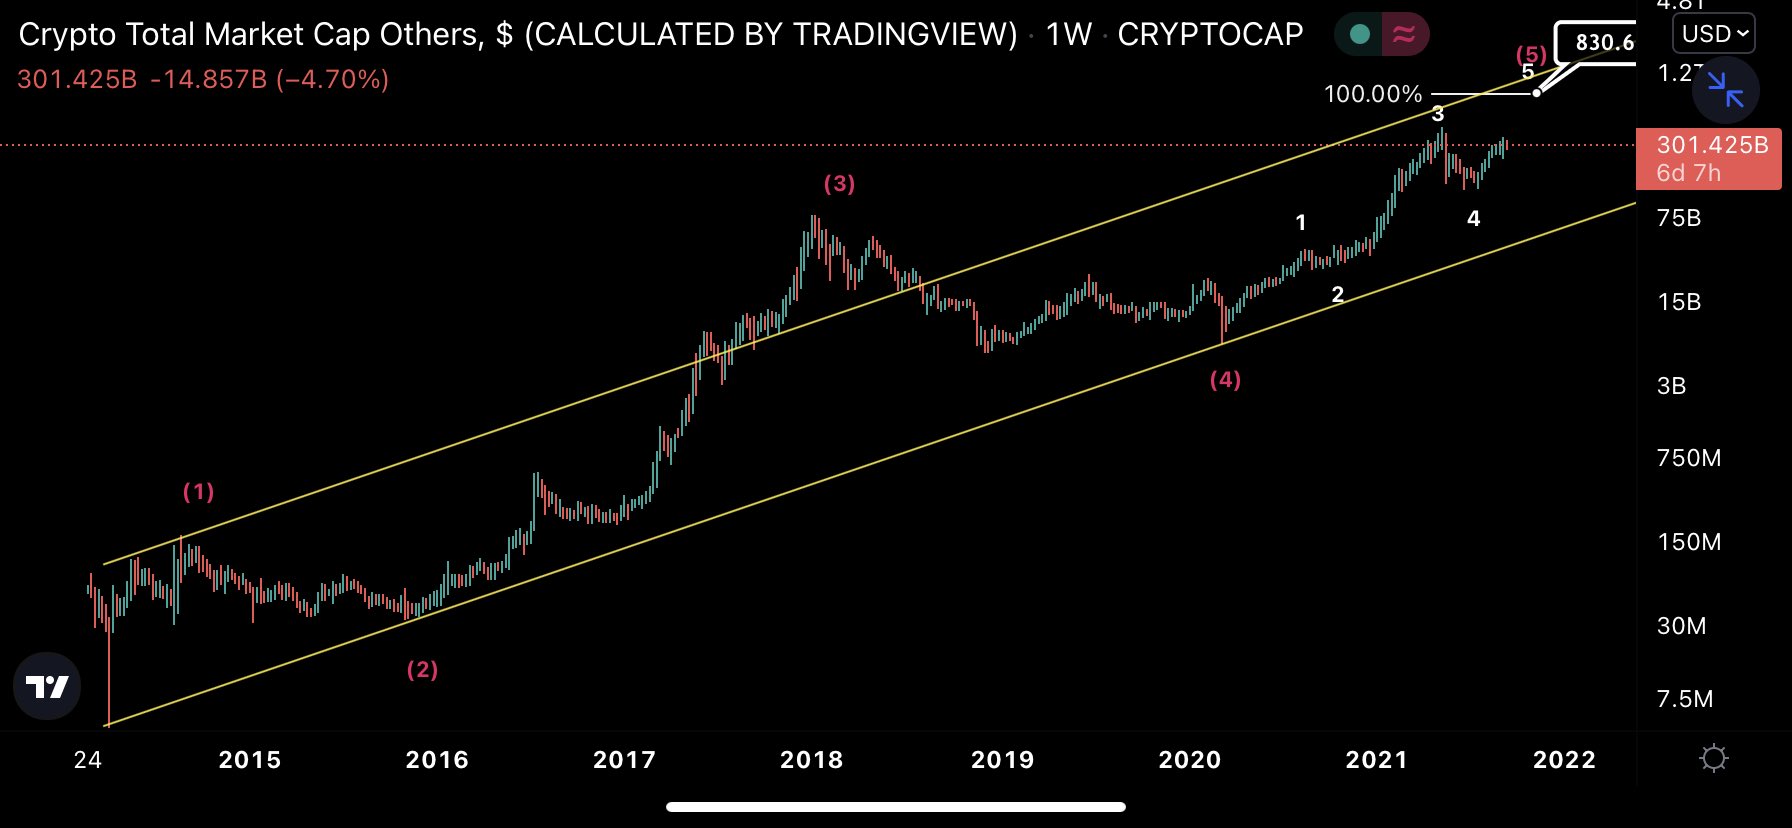
Cryptocurrency trader @Mesawine1 outlined an altcoin marketcap chart, stating that the fifth and final wave is likely to take it well into a new all-time high.
When looking at the movement since 2015, this does seem like the most likely wave count, in which ALTCAP is in the final sub-wave (red) of the final wave (white) of a bullish impulse.
Therefore, a new all-time high is eventually expected.
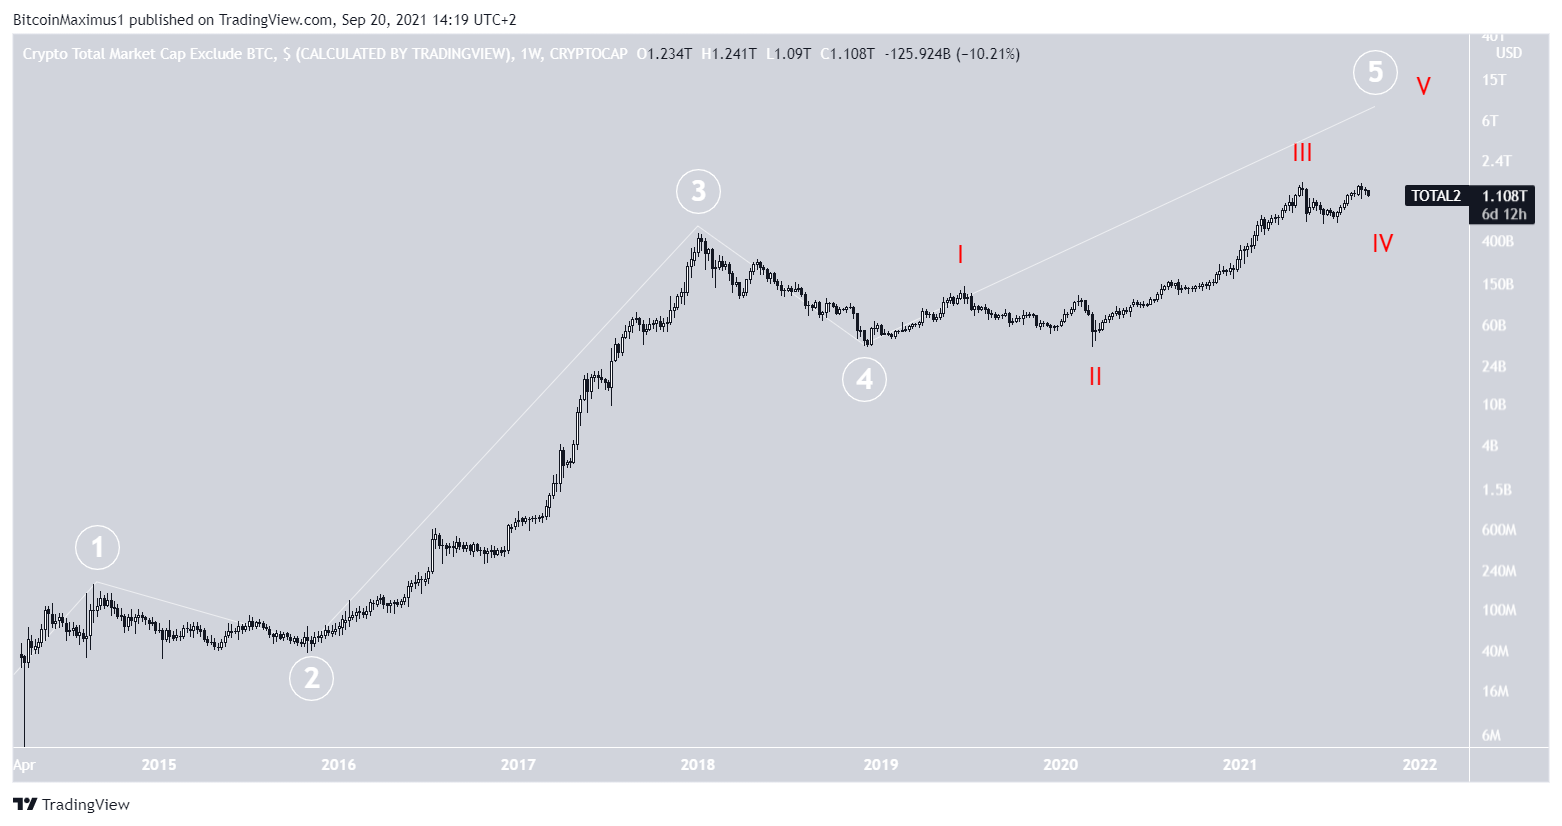
However, it is not yet clear if the longer-term wave four (red) has ended or if it is still developing. Due to the shape and length of the preceding wave two, it is more likely that ALTCAP is still in wave four and will consolidate more prior to an eventual breakout.
For BeInCrypto’s latest Bitcoin (BTC) analysis, click here.
Disclaimer
All the information contained on our website is published in good faith and for general information purposes only. Any action the reader takes upon the information found on our website is strictly at their own risk.

 Valdrin Tahiri
Valdrin discovered cryptocurrencies while he was getting his MSc in Financial Markets from the Barcelona graduate school of Economics. Shortly after graduating, he began writing for several different cryptocurrency related websites as a freelancer before eventually taking on the role of BeInCrypto’s Senior Analyst.
********************************************************************************************************************
Altcoin Market Cap Needs Support

VISIT OUR OTHER SITES:
Check Out Our Crypto Privacy Site: CryptoGrizz.com
Check Out Our Crypto Trading Site: CryptoGrizzTrader.com
Check Out Our Low Cap Altcoin Site: CryptoGrizzAltcoins.com
Check Out Our Prepper Site: PrepperGrizz.com
Check Out Our Global Crypto Survival Site: GlobalCryptoSurvival.com